Starbucks vs. Dunkin Donuts: A Study in Contrasts — Part II
Starbucks vs. Dunkin Donuts: A Study in Contrasts — Part II
So, in our last entry we showed how different these two beverage companies are, in terms of how they operate and the experiences they provide. We also revealed that one of the chains is much larger.
Thing is, we know not the details of each company’s actual profitability. Dunkin , being nearly entirely franchised, carries a far smaller overhead than Starbucks who owns 53% of its locations outright.
Assuming both audiences are addicted to caffeine, as let’s face it, most of us are, and the fact that one can’t always make it out the house, we took a look at what store-bought coffees most caught the attentions of each audience.
With those discussing Dunkin only five brands exceeded the baseline (i.e., the average social media user), so far as their social media fandom was concerned, and that was only when sorted by multiple.
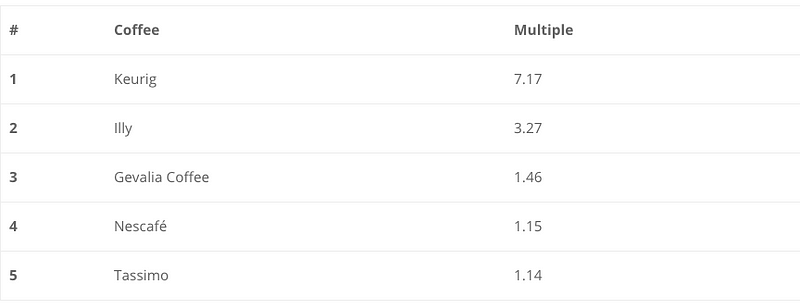
They are seven times more likely to dig the admittedly far better than you think it will be, Keurig single cup, home brewing machine. The remainder are somewhat premium brands, with good ol’ Nescafé just sticking out like a sore thumb and thinking “you’re not better than me, we are a Fortune 100 company, y’know?!”
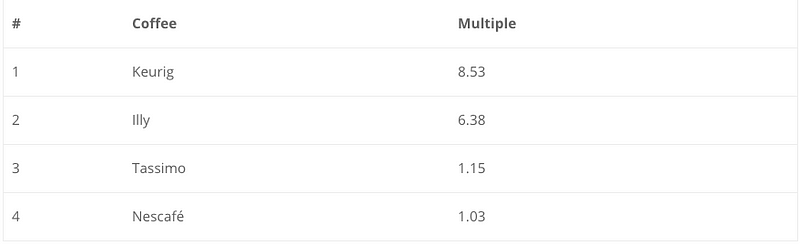
Then, we subjected the Starbucks group to the same investigation. In their more selective view, only four coffees exceeded the baseline, and again only when sorted by multiple. They are eight and a half times more likely to dig the Keurig machine. Then the next two are two of the same premiumish brands that appear above, and then Nescafé squeaks in, .03 above the baseline. Just to remind you it isn’t going anywhere.

Here we see a married couple. Their comments on social media over the past month — regarding their favorite things — found them statistically lumped in with all others who commented on those things over the same period of time, in a report which analyzed their likes, dislikes, behaviors, and even personalities. But why are they so excessive? The pile of donuts, two beverages each? Seems a bit much. Well, they’re immoderate as well. But how do we know that? Why don’t you keep reading and find out?
Within the past year StatSocial took on a robotic enhancement, of a sort, not unlike a bionic limb but even more powerful, courtesy of a partnership with IBM Watson .
A small while back now, we integrated IBM Watson’s powerful, cognizant Personality Insights ™ tool into our reporting. What it does is scour every last syllable of an individual’s collected online writing, be it in their blogs, on social media, or wherever else they’ve publicly posted their thoughts and feelings throughout cyberspace. From this, with incredible accuracy, it creates a personality profile on that individual.
Through Personality Insights ™ allowing us to harness this analysis, StatSocial can now tell you not just the demographics you’d insist on at a bare minimum, nor even what an audience likes, dislikes, does for a living, and in their spare time, and all the other, detailed insights a StatSocial report provides. We now know of what types of people an audience is comprised.
Are they artistic, generous, sentimental, angry, impatient, altruistic? We now know, and you will too.
(You can read more about all of this here .)
In the case of these commenters, they shared one trait above all others. Immoderation.
THE TOP 10 PERSONALITY INSIGHTS™ AMONG THOSE WHO WROTE ABOUT DUNKIN DONUTS, BY PERCENTAGE
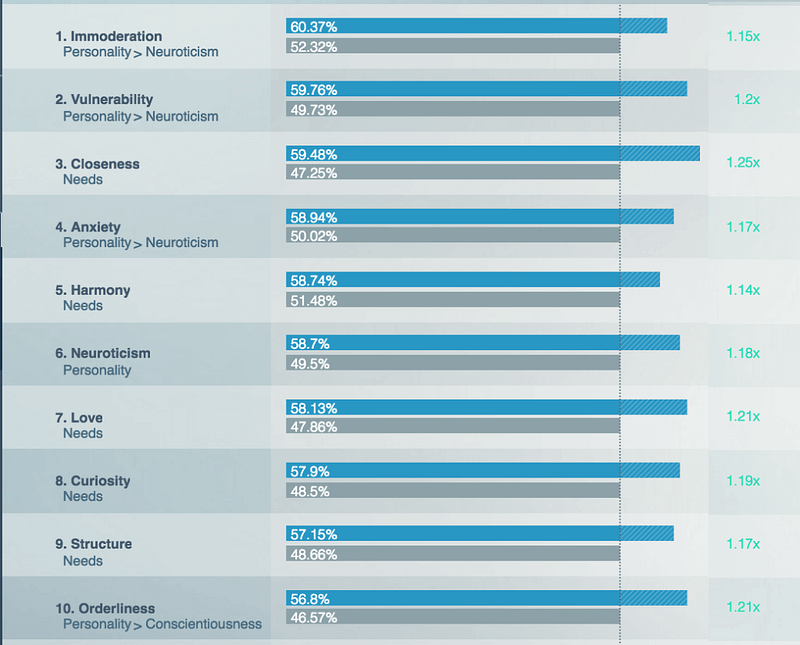
THE TOP 10 PERSONALITY INSIGHTS™ AMONG THOSE WHO WROTE ABOUT DUNKIN DONUTS, BY PERCENTAGE
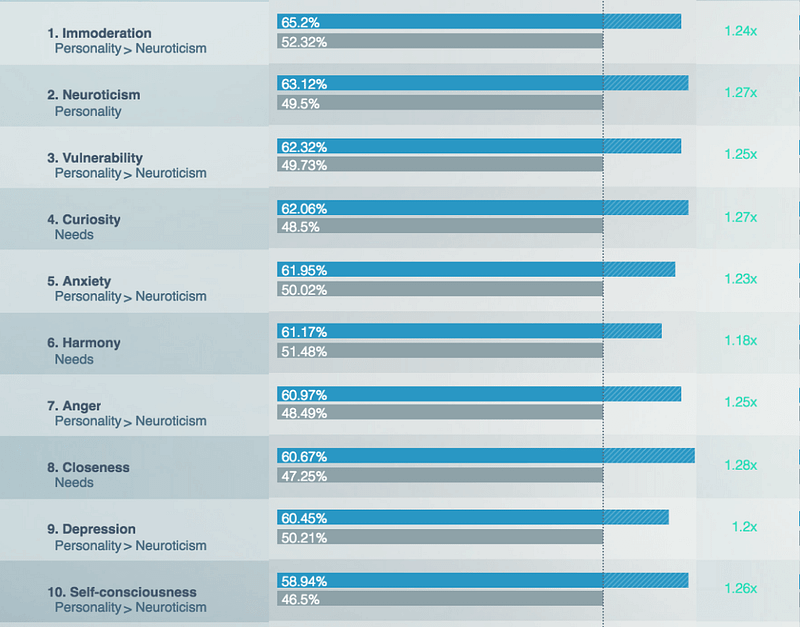
Personality Insights ™ defines immoderation, thusly:
“Feel strong cravings and urges that they have difficulty resisting, even though they know that they are likely to regret them later. They tend to be oriented toward short-term pleasures and rewards rather than long-term consequences.”
WE DON’T JUDGE YOU STARBUCKS AND DUNKIN DONUTS COMMENTERS. We are none of us perfect, and we all have our equivalent vices to Iced Macchiatos and Mocha Frappuccinos. Perhaps the lack of moderation was expressed in their need to discuss it all so frequently online.
Okay, that’s the raw numbers. Basic percentages. Let’s compare them to the rest of the social media sphere and how much more likely they are than the average social user to be one way, or another, by sorting their Personality Insights ™ by “multiple.”
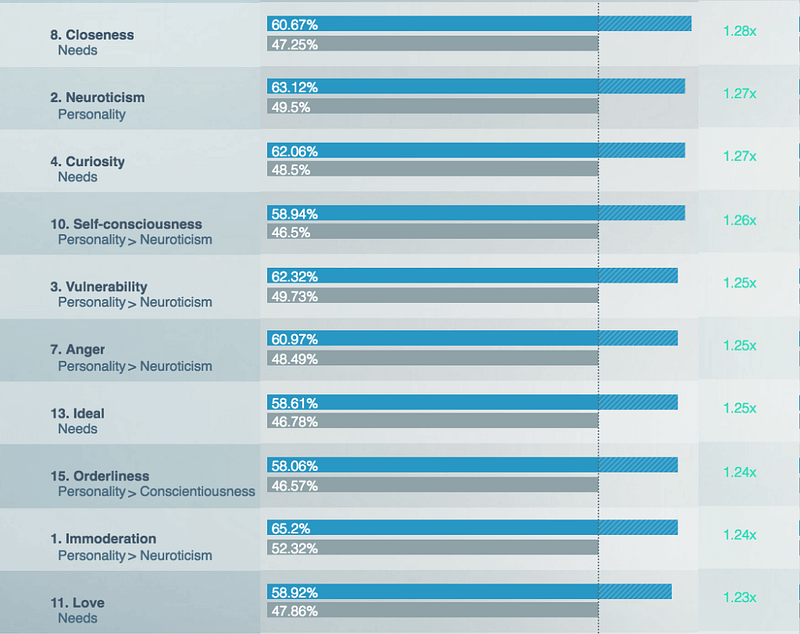
THE TOP 10 PERSONALITY INSIGHTS™ AMONG THOSE WHO WROTE ABOUT DUNKIN DONUTS, BY MULTIPLE
THE TOP 10 PERSONALITY INSIGHTS™ AMONG THOSE WHO WROTE ABOUT STARBUCKS, BY MULTIPLE
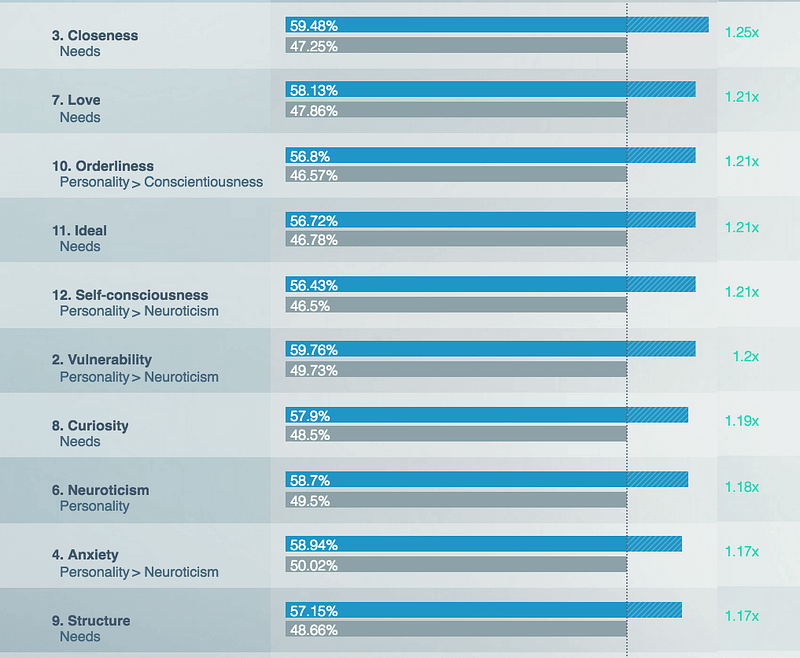
Again, they share a top trait, but this one is a need for closeness. Personality Insights ™ tells us such people “Relish being connected to family and setting up a home.” While not for everyone, this is certainly a calling and a feeling both noble and sympathetic. Although one driving and/or tormenting these groups to only a small degree more so than the average social media user.
Still, the urge is there.
We’re not here to tell anyone how to live, but maybe get your immoderation under control before starting a family. Why drag a kid into all of that?
Now, as a marketer, brand, or product you are free to draw your own conclusions about each and every audience you analyze and compare.
But, as with all of our blog entries, we hope to expose you to the frankly magnificent capabilities of StatSocial , fire up your imaginations as to how you could apply these analyses to your own social marketing, and keep you entertained and informed while doing so.
To learn much more about StatSocial , the curious are encouraged to visit the StatSocial site itself, where you’ll find all sorts of stuff including sample reports.
— -
If you like what you’ve read, please take a few minutes to watch this overview of StatSocial’s data: