“StatSocial Clusters” — Consumer and Household Segmentation with a Social Psychographic Twist
“Digital Tribes” — Consumer Segmentation with a Social Psychographic Twist
CLICK HERE TO SEE THE LIST, AND DESCRIPTIONS, OF ALL 100 OF OUR DIGITAL TRIBES.
Is your target audience a Basketball Jones or Just A Jump To The Left ? A K ulture Kween or a Mostly Marvel ?
The answer lies in our new StatSocial Digital Tribes ; a model of the US population broken down into 100 unique market segments.
StatSocial is a social media audience insights platform. Our unique technology enables us to make sense of the billions of unstructured social web interactions that go on each day — allowing you to make sense of nearly any audience you can imagine.

What we do
Social media has transformed the way consumers engage with brands. Take Twitter , for example. You can follow HBO ’s ‘ Game of Thrones ,’ share a relevant Business Insider article, and even tweet directly at Wendy ’s ( only to get roasted back ).
Understanding your social media audience unlocks a whole new level of psychographic insight, allowing you to measure consumers’ attitudes and interests.
Demographics are essential; they define who your consumer base is. Gender. Age. Marital status. State of residence. But, psychographics answer the why ; meaning, why these individuals consume your product in the first place.
Each enhances the other. Yin and yang. Demographics and psychographics . The two are complementary forces.
With the one-of-a-kind insights made available to us through both, StatSocial ’s advanced segmentation tools enable brands, publishers, media buyers, and agencies to gain a comprehensive, in-depth understanding of their target audiences.

Let’s break it down
Traditional market segmentation
Traditional clustering models, such as PRIXM , Personicx , Mosaic , and Tapestry have paved the way for more personalized market segmentation.
These models break down audiences based on demographic, geographic, and offline consumer data. PRIZM adds a component of media habits (such as TV channels surfed and newspapers read), while Personicx highlights their socioeconomic status and financial activity classifications. Mosaic , on the other hand, is focused on delivering the operational and logistical data needed to fuel Business Intelligence ( BI ).
StatSocial: An extra layer of social behavior
StatSocial is the first in the game to integrate social activity and Personality Insights ® (powered by IBM Watson ), creating distinct segmentation models.
At StatSocial , we know whether your customers read The Atlantic, or perhaps The Weekly Standard. Do they listen to NPR , or maybe TheBlaze , or both? We know all about it. Are your customers ContraPoints people, or more about Blaire White? Are they urban-dwelling women, in their 30s and 40s, nestled comfortably within the “ Lattes, Brunch, & Subtitles ” Tribe. Are they whiling away the hours at the most chic of cafés keeping up with the latest tech news from Digital Trends , Engadget , and Mashable, and are therefore also members of the “ That’s a Heck of a Lot of Tech ” crowd?
We already know, and are eager to fill you in on. These are not trivial tidbits for the curious, but vital and wholly actionable insights. The real-world value of knowing whether your faithful consumers are frugal, “ A Bargain Around Every Corner ” shoppers, or dwelling among the more extravagant “ Fashionista Pashionistas ” Tribe, is considerable.
We believe that online behavior is reflective of the full customer portrait. We’ve developed the math and data expertise to provide details about your audience that would have previously cost untold quantities of money, and required months upon months, or longer, of intensive surveys, focus groups, and research to obtain.
Our customer insights are gathered from over 60 social networks and every major blogging and public messaging platform. Our multi-layered taxonomies index over 370 interests, 10,000 media properties, 10,000 consumer brands and over 30,000 celebrities and influencers.
We know your consumers down to their favorite beauty YouTube channel, their go-to camera brand, their most beloved fast food restaurant. We know what movie genres most excite them, what apps they find most essential, and what kinds of cars they own. With the integration of IBM Watson into our unique data analytics, we also know what motivates their consumer decisions. This means we have unprecedented insight into your audience’s values, needs, and their personality traits.
If our calculations reveal an overwhelming interest in a broad category (like, say, finance, tech, or music), we can dig even deeper into specifics (such as “ cryptocurrency ,” “ investments/brokerage ,” “ JavaScript ,” or bands under “ alternative music ”).
We segment social audiences using over 50,000 defining variables — allowing us to meet your needs with acute precision.
Right place, right time
The social behavior analysis that is central to our reporting enables marketers to understand and reach their best customers through the right channels, with the right message, at the right time.
✓ We equip publishers with rich demographic and psychographic data about the visitors engaging with their content.
✓ We arm brands with the comprehensive consumer data they need to create well-rounded, individual-level customer profiles.
✓ We supply agencies with the detailed audience analyses essential to evaluating campaign effectiveness and informing decision-making.
✓ And we provide media buyers with the tools to measure online engagement with offline media in order to hone digital spending.

StatSocial Digital Tribes
We harness the power of social media to classify clusters of consumers and reveal powerful relationships in consumption habits and interests.
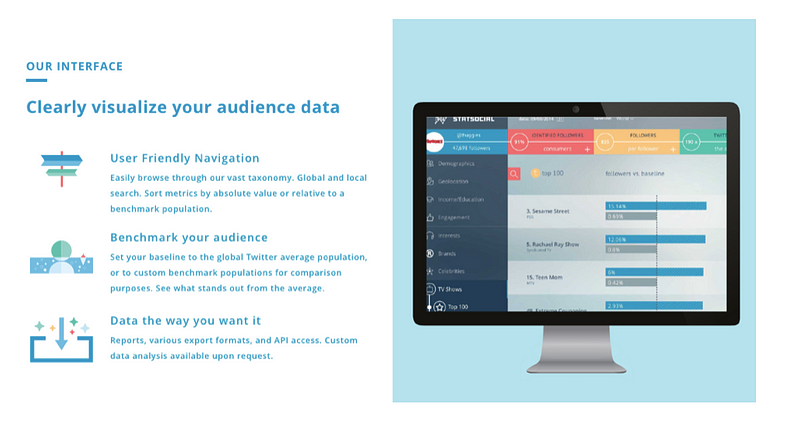
User-friendly, interactive interface
Most traditional models extract data into static, unmoving PDF files or presentations.
The interface of StatSocial ’s web platform, on the other hand, is interactive and user-friendly. Our data scientists work hard behind-the-scenes to bring you reports that are comprehensive yet digestible.
Want to see for yourself? Let’s run a sample report :
Chick-fil-A vs. Shake Shack
The below example is not a case of us sharing our tech-y backend for the sake of this entry. What you see is universal to all of our reports. Our web platform’s interface (what you see screen-capped in the graphics below) is made up of an easy-to-navigate toolbar, visuals, graphs, reader-friendly text, and indexes.
The best part? We refresh the reports at the start of every quarter.
Indexes are provided for every attribute in our reporting.

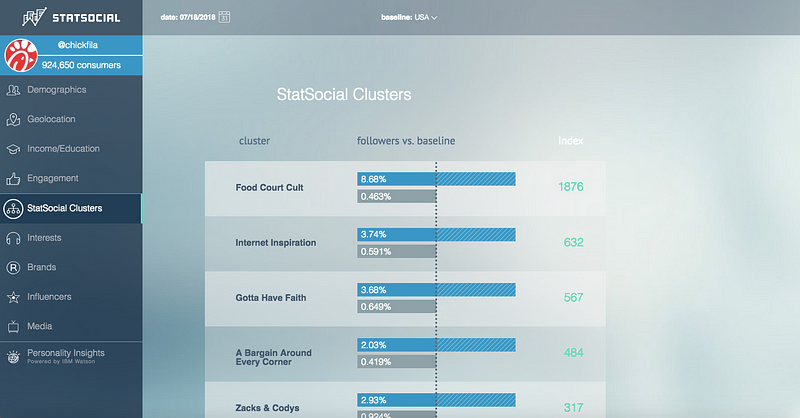
Looking at Chick-fil-A here, we can see that members of the “ Food Court Cult ” Tribe — our fun name used to describe the Tribe made up of American chain restaurant devotees — are greatly over-indexed when measured against the baseline used for this report (the average U.S. online audience).
The index score of of 1876 tells us that the percentage of Chick-fil-A diners who are also “ Food Court Cult ” members exceeds the occurrence of their ilk among the greater U.S. online crowd by 18.76 times .
Hovering over a given Tribe ’s name on our web platform (as screen-capped below) provides a description of what common affinities and personalities find them as part of that segment.
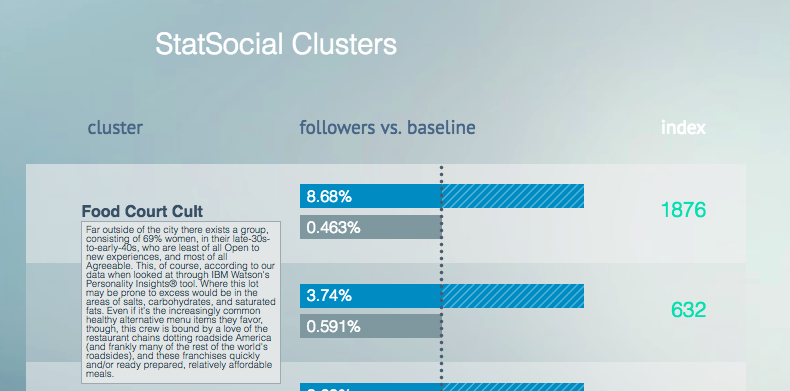
If you’ve trouble reading the image here, it says:
Food Court Cult:
Far outside of the city there exists a group, consisting of 69% women, in their late-30s-to-early-40s, who are least of all Open to new experiences, and most of all Agreeable (when looked at through IBM Watson’s Personality Insights® tool). This lot may be prone to excess in the areas of salts, carbohydrates, and saturated fats. Even if it’s the increasingly common healthy alternative menu items they favor, though, this crew is bound by a love of the restaurant chains dotting roadside America (and frankly many of the rest of the world’s roadsides), and these franchises’ quickly and/or ready prepared, relatively affordable meals.
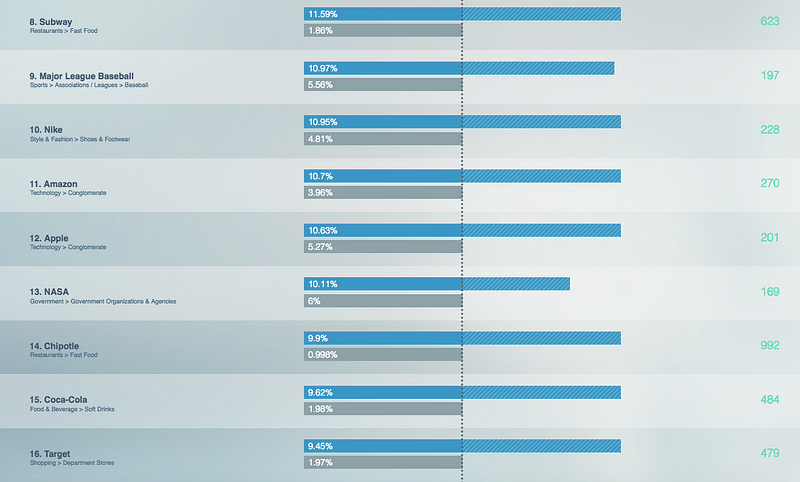
Next, if you click on “ Brands ,” then “ Top 100 ” in the side bar, the degree to which their membership in this particularly savory Cult is real and irrefutable is made abundantly clear.
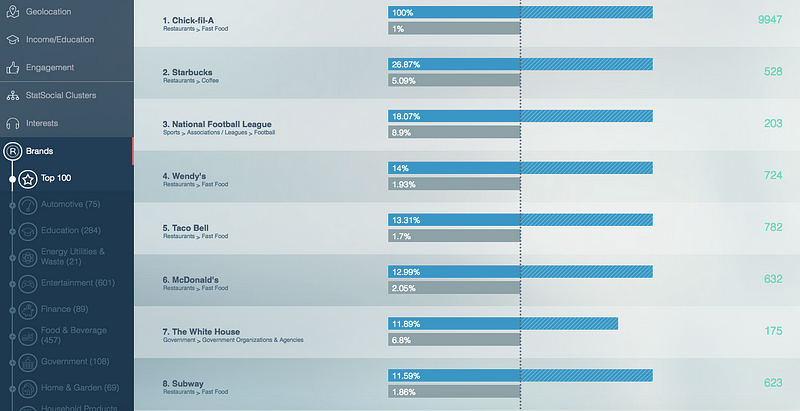
Unsurprisingly, Chick-fil-A leads across all categories (but, this isn’t the real shocker). The interesting part is discovering the other brands and interests rating highly with Chick-fil-A ’s online consumer base.
Across all categories, six of the top eight over-indexed brand favorites are made up of fast food chains (yes, Starbucks is fast food).
Hold your horses, though. This doesn’t mean Chick-fil-A consumers like Starbucks more than the NFL , or Taco Bell more than The White House. It means that they’re more likely to engage with food brands in the digital sphere than they are the sectors of those brands ranked lower on the above list.
Next, if you scroll to “ Restaurants ” in the sidebar (still under the category of “ Brands ”), then double-click on “ Family Restaurants ” or “ Fast Food ,” you’ll find a full run-down of the meal options that hold the attentions of Chick-fil-A’ s vocal and dedicated online stans.
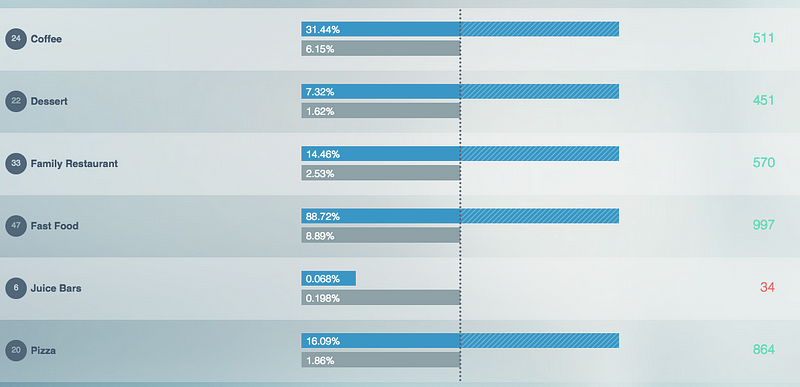
If we go beyond food, we get to draw relationships between different consumer markets (like, favorite consumer electronics, top TV shows, preferred news outlets, home and garden needs, and so on). Take a look around, and please read our full Chick-fil-A report .

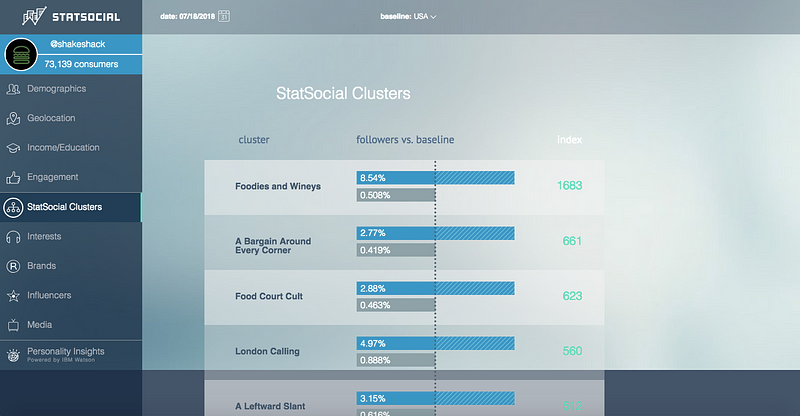
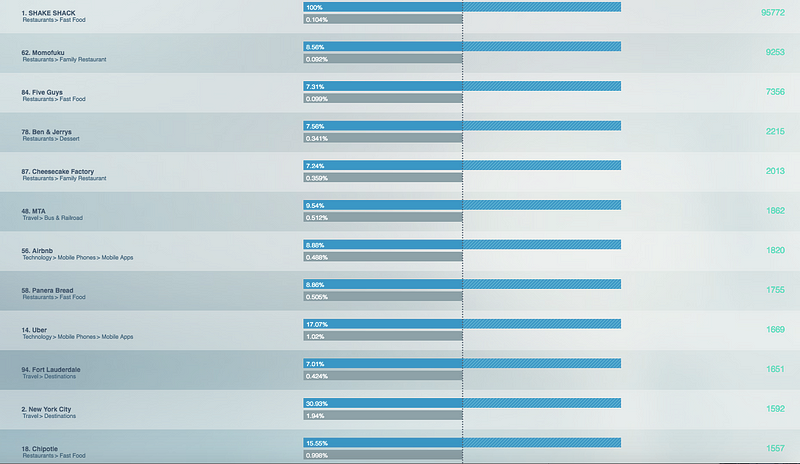
For clear contrast, we’ve run the same report for Shake Shack . Let us take this moment to remind you that here we’re only looking at the top StatSocial Digital Tribes to be found among the online audience of this celebrated chain. This is so much the tip of the iceberg that the iceberg barely remembers its even there. There is so much beyond what we’re sharing here that we could tell you.
Members of the “ Foodies and Wineys ” Tribe are chilling amongst the Shack Shack online throngs to a degree that surpasses their occurrence among the average U.S. online audience by 16.83 times .
See below:
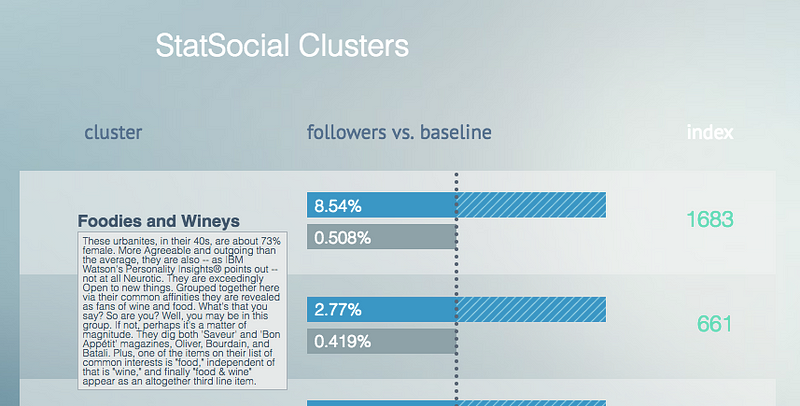
And again, if the description — visible for all 100 Tribes , when hovering over a given T ribe ’s name on our web platform (and screen-capped above) is not legible, we provide the below.
Foodies and Wineys:
These urbanites, in their 40s, are about 73% female. More Agreeable and outgoing than the average, they are also — as IBM Watson’s Personality Insights® points out — not at all Neurotic. They are exceedingly Open to new things. Grouped together here via their common affinities they are revealed as fans of wine and food. What’s that you say? So are you? Well, you may be in this group. If not, perhaps it’s a matter of magnitude. They dig both ‘Saveur’ and ‘Bon Apetite’ magazines, Oliver, Bourdain, and Batali. Plus, one of the items on their list of common interests is “food,” independent of that is “wine,” and finally “food & wine” appear as an altogether third line item.
Momofuku is second on the list. A notable result for a restaurant located only in NYC, Sydney, Toronto, Washington, D.C., and Vegas. Quickly, the relationship between city-dwellers and Shake Shack eaters is more than suggested. Transportation categories are also heavily over-indexed, we find NYC’s mass-transit providers, MTA , as well as Airbnb , Uber , and such popular tourist destinations as NYC and Fort Lauderdale. A rather pronounced contrast next to Chick-fil-A’ s consumers whose top-ranked brands seem utterly unconcerned with the explicitly cosmopolitan or in any way being “on the go.”
Chick-fil-A ’s top cities are jewels of the southland, such as Athens, Atlanta, and Knoxville, as well as Floridas Lakeland and Tuscaloosa.
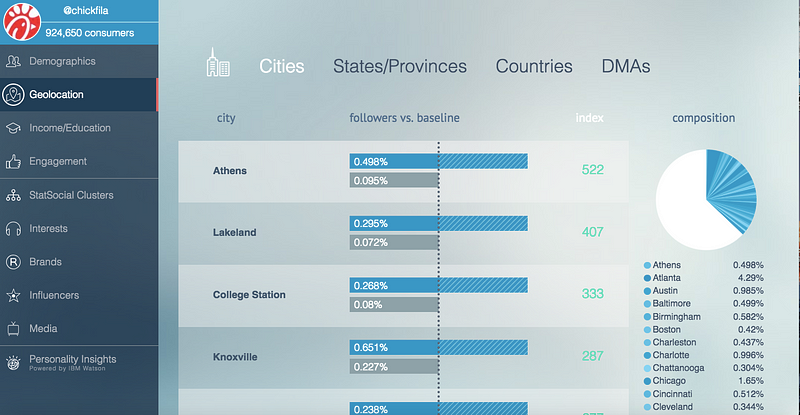
The Chick-fil-A crowd’s strong connection to its southern roots is conspicuously different than where we find the Shake Shack faithful residing.
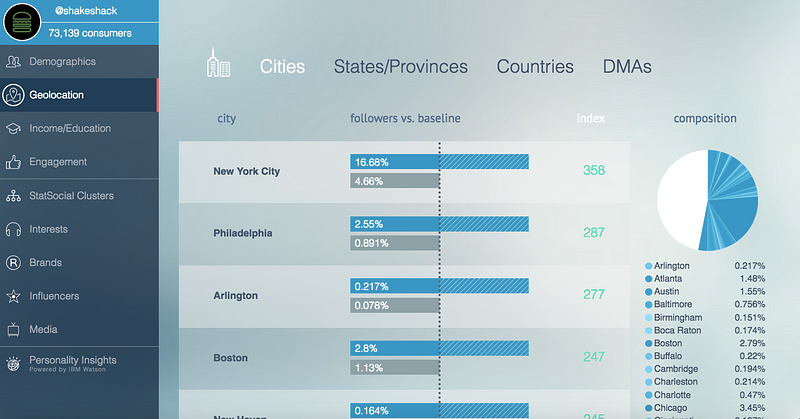
NYC, Philly, Boston, D.C., Miami Beach, Austin, Chicago, San Francisco… The Shake Shack- ers are more dispersed throughout the regions of this great. The southern towns where these diners can be found tend to be noted for the progressive views of their residents.
Take a look around our blog to see many more side-by-side comparisons of competitors (and sometimes collaborators) from a variety of sectors, as well as entries focused on one particular audience. You will also find an assortment of fun and entertaining demonstrations of the many facets and applications of StatSocial ’s comprehensive, but easily managed and understood, insights.
If we may curate your journey into our blog, you can find an explicitly Digital Tribes focused entry — looking at Taco Bell’s audience — here . Our entry c omparing the users of Salesforce to those of HubSpot highlights how the detail and depth of StatSocial ’ s calculations allow our users to identify, with ease, the differences between audiences that less thorough analysis would conclude are fundamentally alike.
You are invited to check out some sample reports , as well as to reach out to us — or even add us — on Twitter and Facebook .
AUTHOR: Daniela Karpenos
— — — — — — —
INTERESTED?
We encourage you to reach out, so we can schedule a time to chat .
More information on our data can be found here .
And the links below provide information on a variety of the solutions we provide:
To request a full-on demo, click here .